
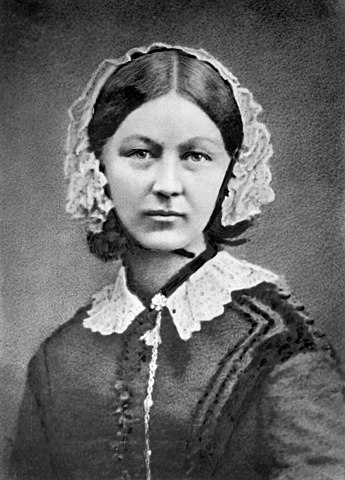
When we hear the name Florence Nightingale, many of us picture the “Mother of Modern Nursing,” often imagined in her white uniform, holding a lamp during her nightly rounds. This image remains a widely recognized symbol of nursing. However, Nightingale had another, lesser-known side: that of an accomplished statistician.
This article sheds light on Nightingale’s achievements as a statistician, exploring her innovative contributions to nursing and public health. We’ll examine the unique statistical methods she developed based on her experiences in the Crimean War, her groundbreaking approach to data visualization, and consider how Nightingale’s statistical approach has influenced modern data visualization techniques and public health policies.
Florence Nightingale (1820-1910): Mother of Nursing and Pioneering Statistician
- Nightingale’s Early Life and Introduction to Statistics
- The Crimean War: A Practical Field for Statistics
- Revolutionary Data Visualization: The Birth of the Polar Area Diagram
- Impact on Public Health Policy
- The Modern Significance of Nightingale’s Statistical Approach
- Conclusion: The Power of Numbers Left by the Mother of Nursing
Nightingale’s Early Life and Introduction to Statistics
Florence Nightingale was born on May 12, 1820, in Florence, Italy, to a wealthy English family. From a young age, Nightingale received an excellent education and showed a particular interest in mathematics, receiving private tutoring from her father.
Her serious encounter with statistics came in the early 1850s. At the time, Nightingale was exploring a career in nursing while also harboring a strong interest in social reform. It was during this period that she discovered the works of Belgian mathematician Adolphe Quetelet, becoming fascinated by the potential applications of statistics to social issues.
Quetelet proposed the concept of “social physics,” attempting to uncover social laws through mathematical analysis of social phenomena. This idea resonated strongly with Nightingale, who aspired to social reform. She began to consider how statistics could be used to objectively analyze medical and public health issues and find effective solutions.
Interestingly, Nightingale never received formal education in statistics. She was self-taught, successfully applying her learning to practical situations. This fact demonstrates her strong intellectual curiosity and her exceptional ability to absorb and utilize new knowledge.
The Crimean War: A Practical Field for Statistics
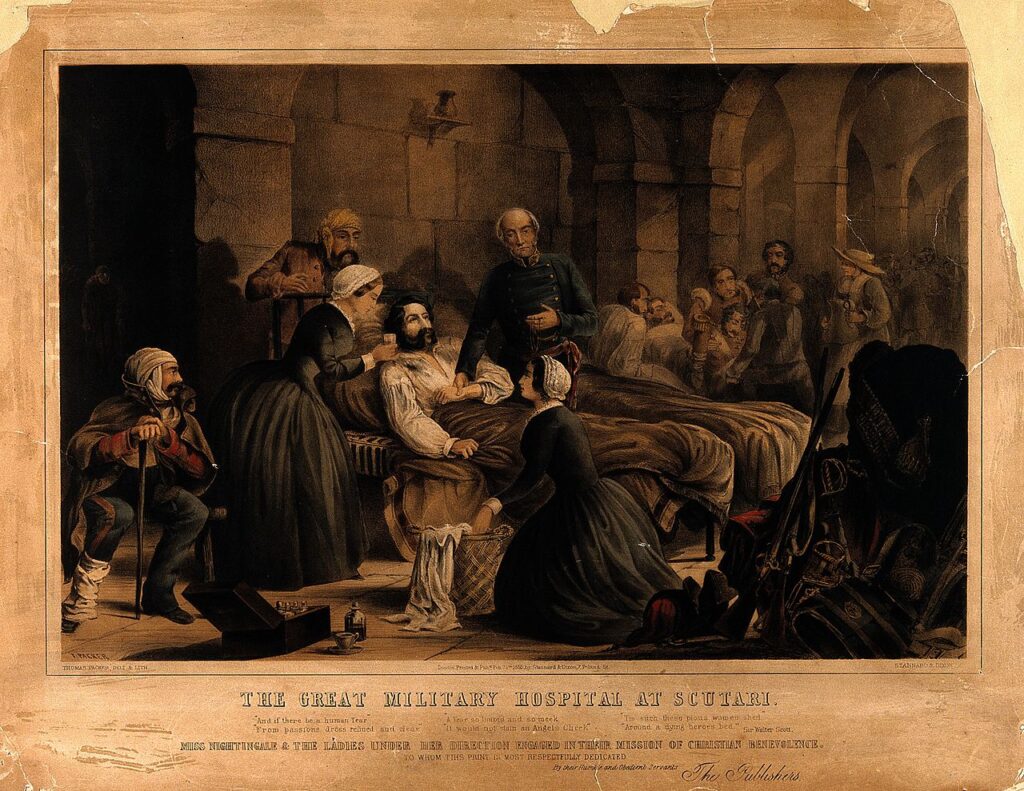
A painting depicting Florence Nightingale and her staff nursing wounded soldiers in beds at the Scutari Army Hospital. The crowded conditions in the hospital and the dedicated nursing care are vividly portrayed. (Circa 1855) See page for author, CC BY 4.0, via Wikimedia Commons
In 1854, with the outbreak of the Crimean War, Nightingale traveled to the front lines as a nurse. This experience became a turning point, allowing her talents as a statistician to flourish.
At the field hospitals, she witnessed appalling sanitary conditions and high mortality rates. Nightingale realized that to improve these issues, she first needed to collect and analyze accurate data. She developed her own record-keeping system, beginning to meticulously document patients’ symptoms, treatments, and mortality rates.
Through this process of data collection and analysis, Nightingale made a startling discovery. The majority of soldier deaths were not due to combat, but to unsanitary conditions and infections. Specifically, 73% of deaths were caused by infectious diseases, while combat-related deaths accounted for only 12%.
Based on this discovery, Nightingale set out to improve the hospitals’ sanitary conditions. Under her guidance, wards were cleaned, ventilation was improved, and wounded soldiers’ clothing and bedding were changed. As a result, the mortality rate dropped dramatically. The death rate, which had been 42% at the start of the war, decreased to just 2% within six months.
Revolutionary Data Visualization: The Birth of the Polar Area Diagram
After returning from the Crimean War, Nightingale prepared a report based on her experiences and data, advocating for the need to improve sanitary conditions in the military. However, she quickly realized that mere lists of numbers lacked the power to convince policymakers and the general public.
This realization led Nightingale to develop her unique method of data representation, later known as the “Polar Area Diagram.” This diagram divided a circle into 12 wedges, with the area of each wedge representing the number of deaths. Furthermore, she color-coded the causes of death, making the breakdown of mortality causes immediately apparent.
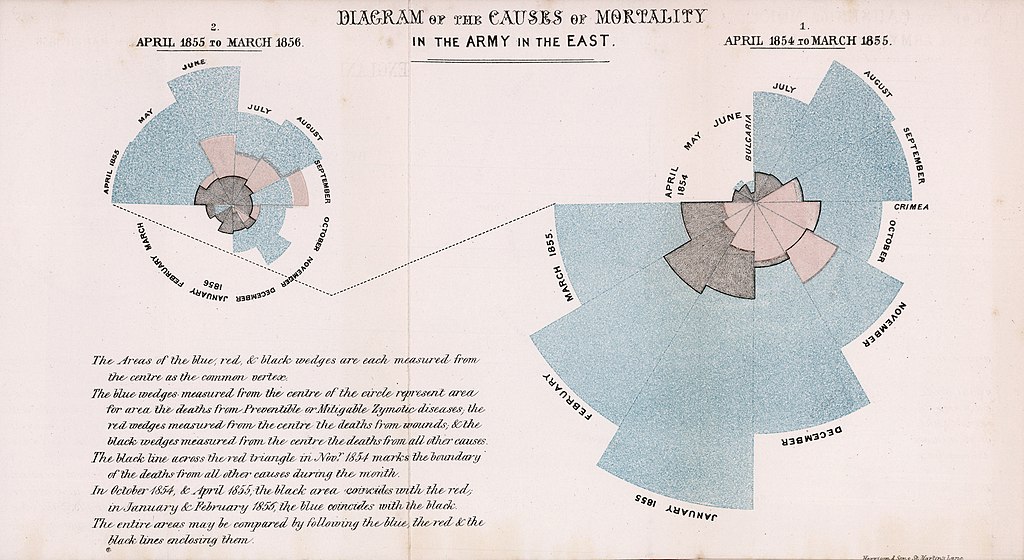
Nightingale’s Polar Area Diagram. This circular graph uses blue, red, and black wedges to represent monthly death rates and causes. Blue indicates deaths from preventable diseases, red shows deaths from wounds, and black represents deaths from other causes.
The innovation of this diagram lay in its ability to present complex data in a visually comprehensible manner. It successfully displayed multidimensional data in a single chart, something that traditional bar graphs or line graphs couldn’t achieve. In particular, the blue wedges made it immediately clear that deaths from infectious diseases far outnumbered combat-related deaths.
Nightingale’s diagram can be seen as a precursor to modern infographics. She demonstrated that data visualization could be a powerful tool for enhancing understanding and influencing policy decisions.
Impact on Public Health Policy
Nightingale’s statistical approach had a significant impact on actual public health policies, extending beyond mere academic interest. Her report and polar area diagram shocked the British government and military, leading to concrete measures to improve sanitary conditions in the army.
For instance, the Royal Commission on the Health of the Army was established in 1858, leading to improvements in military hospital sanitation. Following Nightingale’s recommendations, a system for collecting and analyzing military medical statistics was also established. This enabled continuous data collection and analysis, facilitating more effective public health policy planning.
Furthermore, Nightingale’s influence extended beyond the military to general hospitals and public health policies. Using statistical data, she demonstrated that improving sanitary conditions led to higher patient survival rates, widely promoting the importance of hospital hygiene management.
Nightingale also used statistical data to advocate for improving living conditions among urban poor. Her analysis revealed that unsanitary environments were the cause of infectious disease spread and high mortality rates, leading to reforms in urban planning and public health policies.
The Modern Significance of Nightingale’s Statistical Approach
The statistical approach established by Nightingale is widely used in today’s medical and public health fields. Her emphasis on “evidence-based medicine” has become a fundamental principle of modern medicine.
Moreover, Nightingale’s polar area diagram is highly regarded as a precursor to modern data visualization techniques. Her idea of “visually representing complex data in an easily understandable way” is increasingly important in today’s big data era.
Nightingale’s statistical approach has been applied beyond medicine and public health to analyze and solve a wide range of social issues. For instance, data-based policy-making has become crucial in environmental issues and social welfare.
Notably, Nightingale’s achievements also played a role in promoting women’s social advancement at a time when it was difficult for women to excel in scientific fields. Her success became a prime example of how science and statistics could contribute to society regardless of gender. This had a significant impact on future generations of women, becoming a factor in promoting women’s participation in scientific fields.
Conclusion: The Power of Numbers Left by the Mother of Nursing
Florence Nightingale should be highly regarded not only as the “Mother of Nursing” but also as a pioneering statistician. She utilized statistics as a practical tool for problem-solving, revolutionizing the fields of medicine and public health.
Nightingale’s work vividly demonstrates the power of numbers. Properly collected and analyzed data can be a powerful weapon in revealing social problems and deriving effective solutions. Her method of visually representing complex data proved extremely effective in widely sharing information and forming social consensus.
Many of the complex problems faced by modern society could potentially find better solutions through the approach Nightingale demonstrated—collection, analysis, visualization, and utilization of data. The “power of numbers” she left behind continues to provide us with many insights.
Alongside her image as a nurse, Nightingale’s achievements as a statistician should also be passed down to future generations as a great legacy. Her contributions to statistics continue to be highly valued in modern times, and her foresight and innovation continue to greatly influence today’s fields of statistics and public health.